CoDeKu DevOps Academy Blog - DevOps & Cloud Blogging Platform


👋 Welcome to My Prometheus Monitoring Series!
If you’ve ever wanted to understand how to truly monitor your systems with something powerful and reliable, Prometheus is a great place to start. It’s open-source, super scalable, and widely used in the DevOps world for real-time metrics and alerts.
Whether you’re totally new to observability or already working with infrastructure and just want to dig deeper-you’re in the right place. I’m creating this blog series to walk you through everything step-by-step, with real examples, screenshots, and no fluff.
📚 Table of Contents
- Introduction to the Series
- What is Prometheus?
- What You’ll Need
- Step 1: Create the Virtual Machine
- Step 2: Update Your Ubuntu Server
- Step 3: Download Prometheus
- Step 4: Extract the Archive
- Step 5: Move Binaries to System Path
- Step 6: Create Prometheus Config & Data Folders
- Step 7: Move Config Files
- Step 8: Create Prometheus System User
- Step 9: Set Ownership and Permissions
- Step 10: Create the Prometheus Service File
- Step 11: Start and Enable Prometheus
- Step 12: Access the Prometheus Web UI
- What’s Next in Chapter 2?
🚀 What to Expect
This series will take you from the basics all the way to building real-world dashboards, setting up alerts, and integrating Prometheus with tools like Grafana.
But before we get into the cool stuff, we need to start with the foundation.
🛠️ In Chapter 1…
We’ll set up Prometheus from scratch on a Ubuntu virtual machine running inside VMware Workstation. No Docker shortcuts here – just a clean, manual install so you really get what’s going on under the hood.
I’ll show you every step I followed, explain why we’re doing each thing, and include screenshots to help you follow along easily.
🔍 What is Prometheus?
Prometheus is a powerful open-source monitoring and alerting toolkit designed for reliability and scalability. Originally developed at SoundCloud, Prometheus became a Cloud Native Computing Foundation (CNCF) project in 2016, joining Kubernetes and other modern cloud-native tools.
It is built for collecting, storing, and analyzing real-time time-series data from various systems, applications, containers, and services. Prometheus uses a pull-based model over HTTP, making it ideal for dynamic environments.
🧰 What You’ll Need
Before we start typing commands, let’s make sure you have everything set up. This isn’t a complicated list-just the essentials to get Prometheus running on a virtual machine.
Requirements
| Item | Details |
|---|---|
| Virtualization Software | VMware Workstation or Player installed on your computer |
| OS Image | Ubuntu Server ISO (Recommended: Ubuntu 22.04 LTS) |
| System Resources | 2 GB RAM (minimum) and 20 GB of disk space |
| Network | A working internet connection inside the VM |
| Skills | Basic familiarity with the Linux terminal (don’t worry — I’ll guide you) |
🖥 Step 1: Create the Virtual Machine (in Oracle VirtualBox)
Let’s start by creating a virtual machine where we’ll install Prometheus manually. I’m using Oracle VirtualBox for this setup, but the same concept applies if you’re using VMware.
Here’s the first screen you’ll see when creating a new VM:
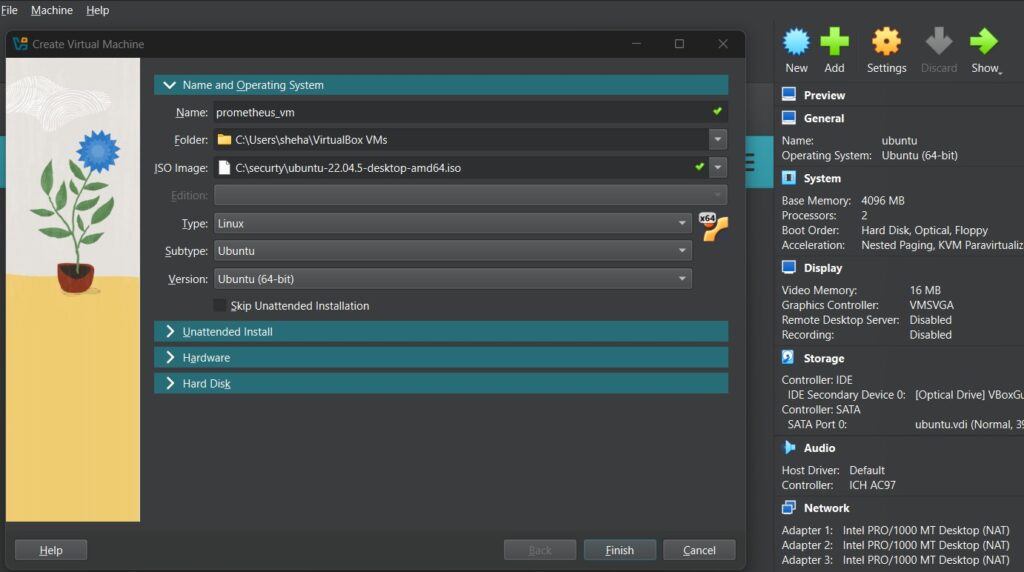
Follow these steps:
- Click “New” in VirtualBox
- Enter a name (e.g.,
prometheus_vm) - Set Type to
Linux, and Version toUbuntu (64-bit) - Browse and select your Ubuntu Server ISO file
- Make sure “Skip Unattended Installation” is unchecked if you want to configure Ubuntu yourself
- Click Next to proceed with memory and disk settings
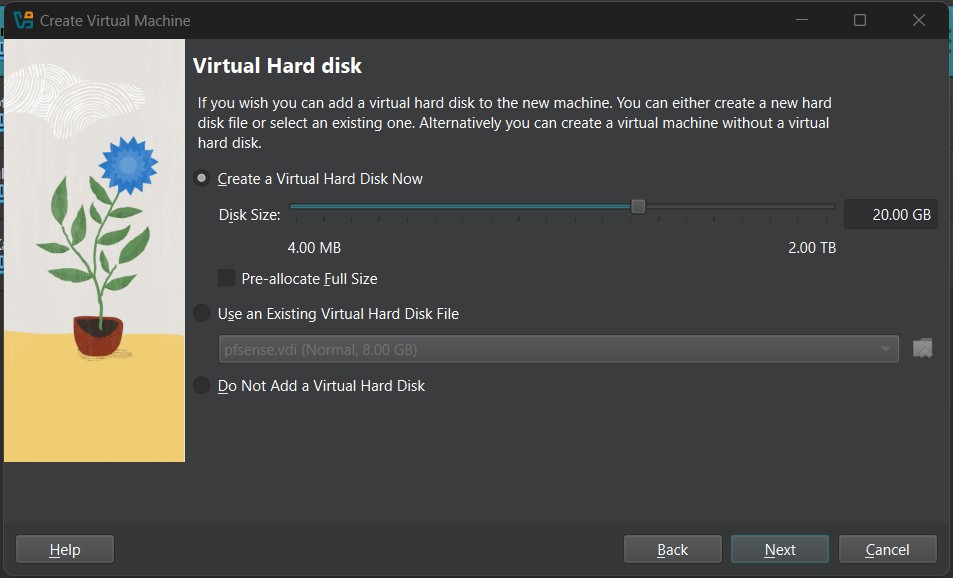
💾 Create a Virtual Hard Disk
Now let’s allocate disk space for the VM:
✅ Review and Finish the VM Setup
Before your virtual machine is created, VirtualBox will show you a summary of all your configuration choices.
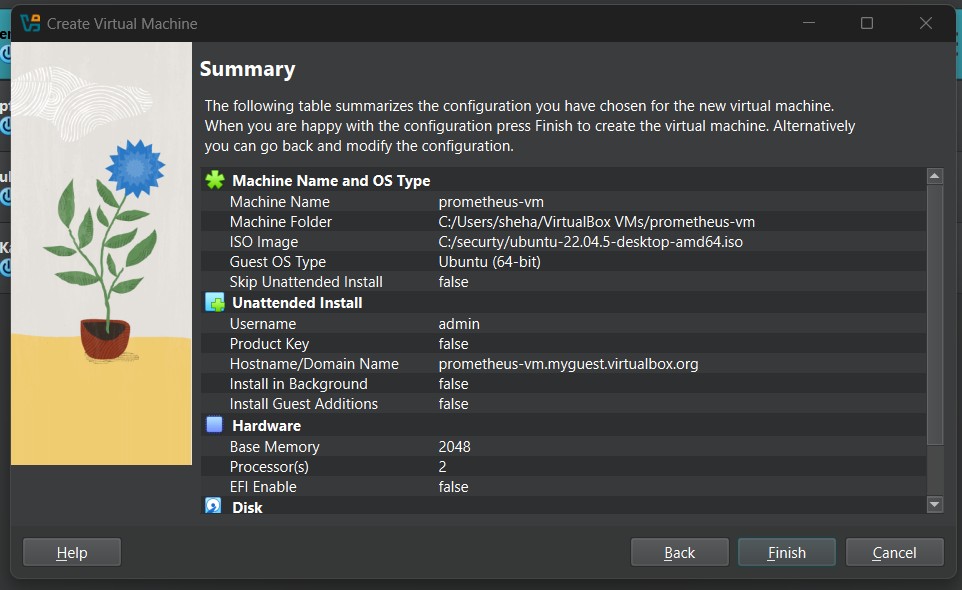
If everything checks out, go ahead and click That’s it! You’ve now created a VM that’s ready for installing Ubuntu and setting up Prometheus manually. Finish.
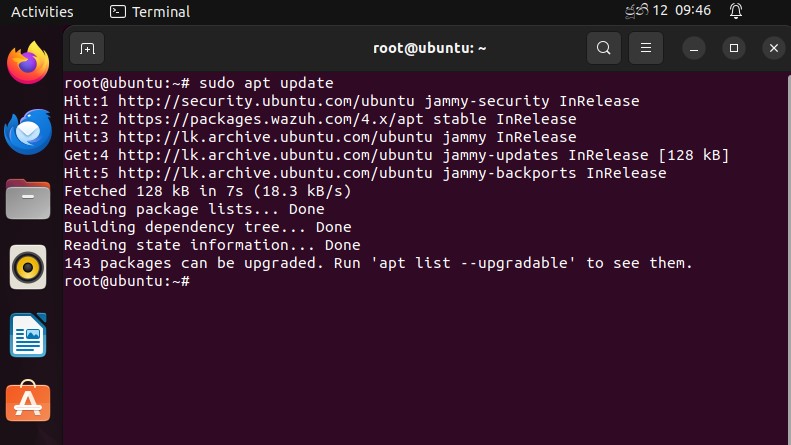
🔄 Step 2: Update Your Ubuntu Server
After successfully completing the VM setup and installation process, go ahead and log into your Ubuntu VM using the username and password you created earlier (in our case, it was admin).
Once you’re in, it’s time to bring your system up to date. This ensures you’re working with the latest security patches and software versions – which helps prevent bugs and install errors later on.
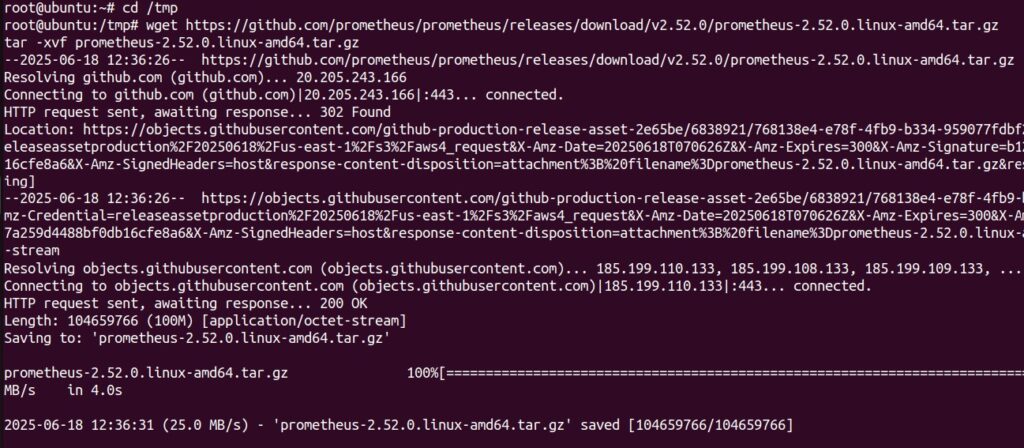
📦 Step 3: Download Prometheus
Now that your system is updated and ready, it’s time to download the latest version of Prometheus from the official GitHub releases.
We’ll be using wget to pull the latest stable Linux binary directly to our Ubuntu VM.
This command will download the most recent .tar.gz release of Prometheus to the /opt directory. In the next step, we’ll extract and install it properly.
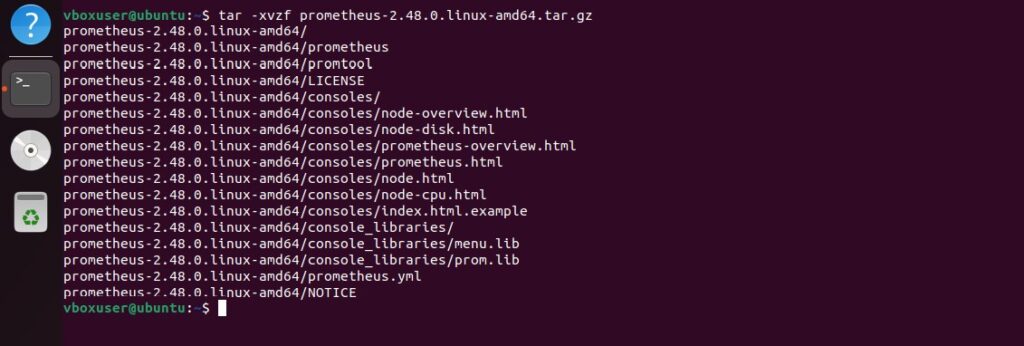
📂 Step 4: Extract the Archive
Now that you’ve downloaded the Prometheus tarball, it’s time to extract its contents so we can start setting it up.
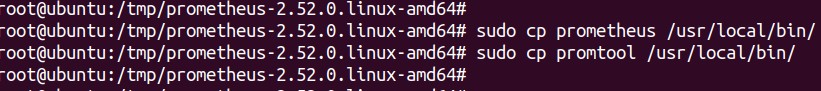
📁 Step 5: Move Binaries to System Path
Now that Prometheus is extracted, let’s move the core executable files — prometheus and promtool —
into a system-wide location so you can run them from anywhere in the terminal.
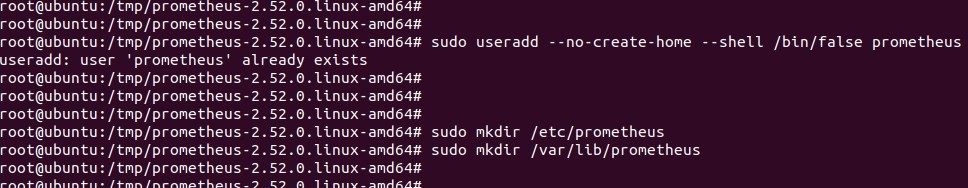
🗂️ Step 6: Create Prometheus Config & Data Folders
Before Prometheus can run, we need to create the directories where it will store its configuration files and metrics data.
sudo mkdir -p /etc/prometheus
sudo mkdir -p /var/lib/prometheus
After creating the direcoroty.check whether it is exits
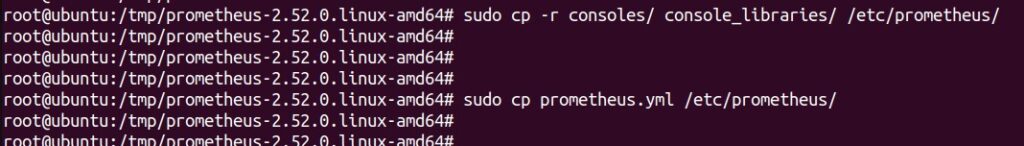
📑 Step 7: Move Config Files
Now that the folders are ready, it’s time to move Prometheus’s default configuration files into the proper location.
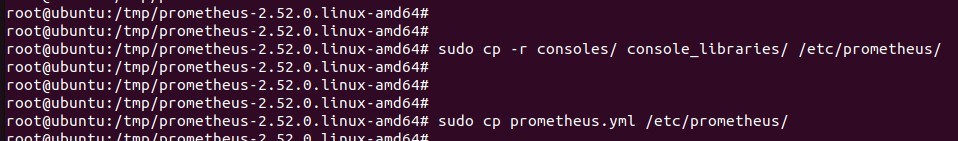
After this, your configuration structure will be in place and ready for Prometheus to use.
👤 Step 8: Create Prometheus System User
Prometheus is designed to run as its own dedicated system user — not as root. This is a best practice for security, so Prometheus has limited system access and cannot interfere with core OS operations.
sudo useradd --no-create-home --shell /bin/false prometheus
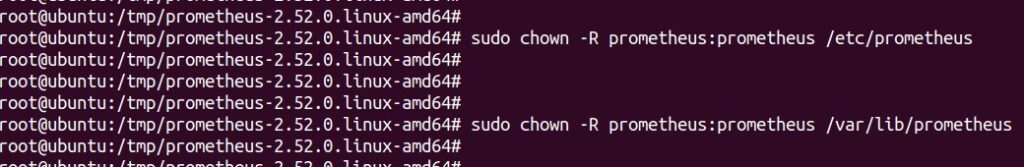
📂 Step 9: Set Ownership of Prometheus Files
Now that the prometheus system user has been created, we need to assign ownership of all Prometheus-related files and directories to that user.
This ensures that only Prometheus has access to read and write its own configurations and data.
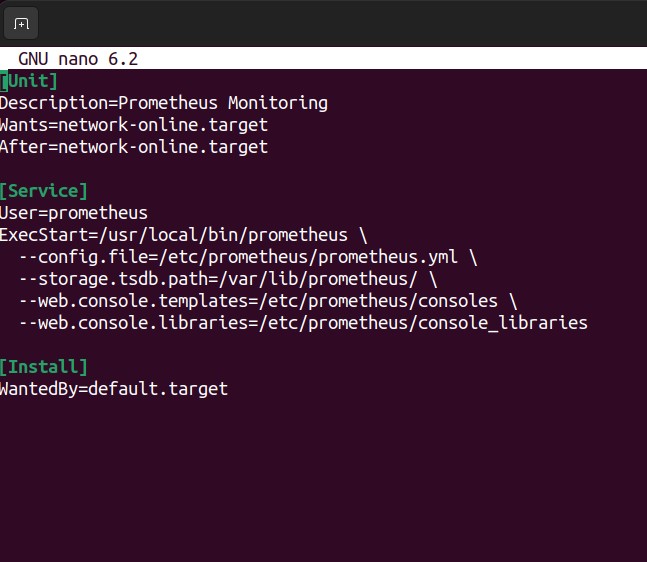
⚙️ Step 10: Create a Prometheus systemd Service File
To run Prometheus as a background service and ensure it starts automatically on boot, we’ll set up a systemd service file.
This lets you control Prometheus with systemctl like any other Linux service.
open a new service file and paste the following content into the file
✅ Step 11: Start and Enable the Prometheus Service
Now that the systemd service file is in place, let’s start Prometheus and make sure it launches automatically every time your server boots.
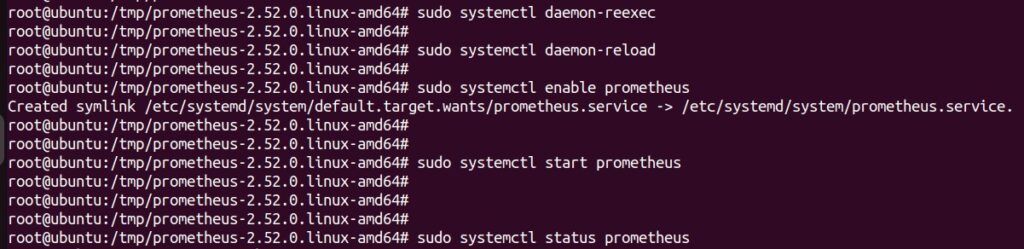
Once started, you can check the service status with:
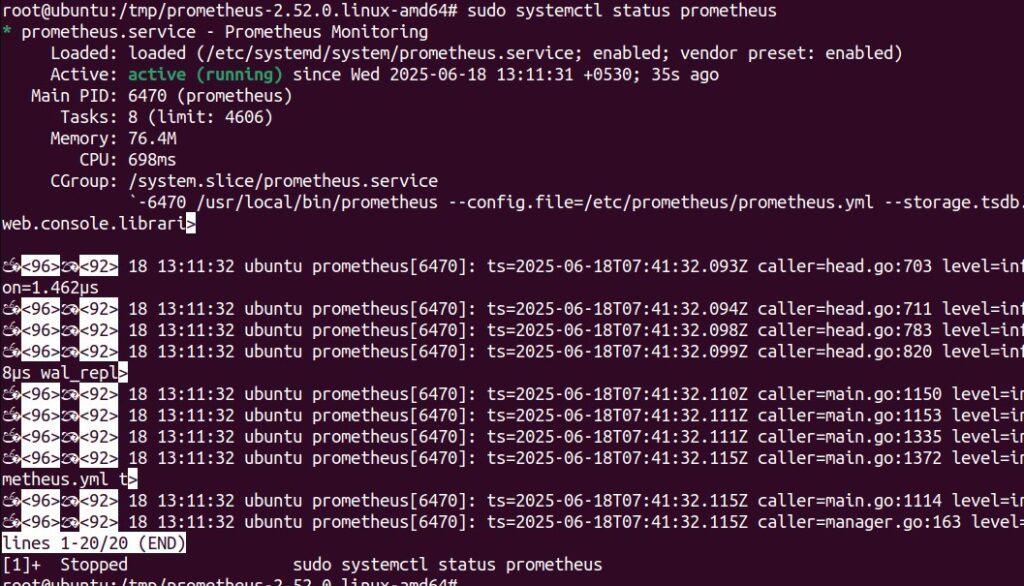
If everything is working correctly, Prometheus should now be running in the background, collecting metrics, and accessible through your web browser.
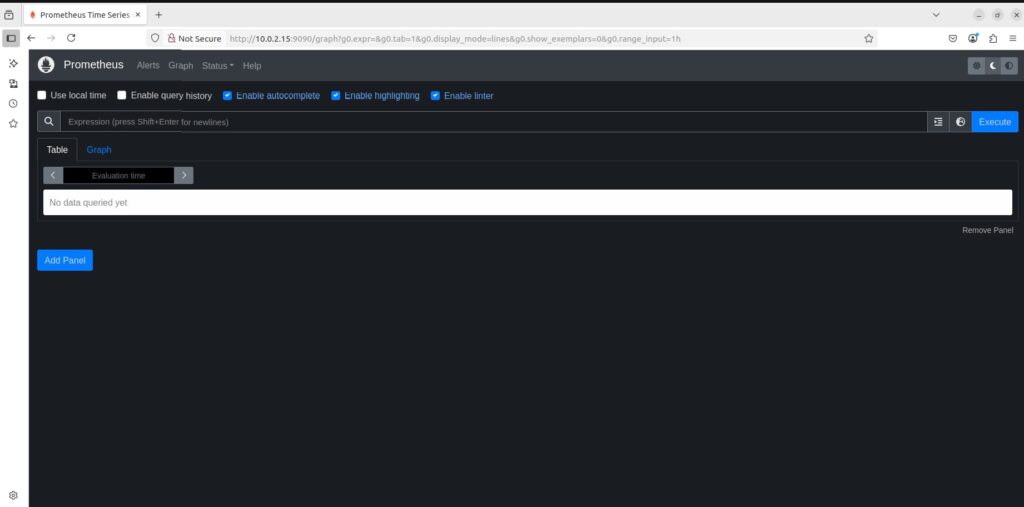
🌐 Step 12: Access the Prometheus Web UI
With Prometheus running as a service, you can now access its powerful web interface through your browser.
Open your browser and visit: http://localhost:9090 ( My VM ip is 10.0.2.15 )
📦 What’s Next in Chapter 2?
With Prometheus now fully installed and running, you’ve laid the foundation for robust monitoring. But Prometheus alone doesn’t know what to monitor-that’s where exporters come in.
In the next post, we’ll explore Prometheus exporters-the essential tools that gather metrics from your system, applications, databases, and network devices.
Start Learning Prometheus Today 🚀
Master Prometheus, one of the most popular monitoring tools out there, and prepare for the Prometheus Certified Associate exam. Build the skills you need to monitor modern cloud-native systems and boost your career.
👉 Start the Course Now
shehan malinga
2 Comments
Comments are closed.


Most Wanted Series. Let’s connect this series with CoDeKu’s Onservability Learning path…
Great idea! Thank you