CoDeKu DevOps Academy Blog - DevOps & Cloud Blogging Platform


👋 Welcome Back to My Prometheus Monitoring Series – Chapter 2: Exporters
In the last chapter, we built a solid foundation by installing Prometheus from scratch on a clean Ubuntu VM. But if you’ve explored your Prometheus dashboard by now, you may have noticed something…
👉 There’s not a lot of data coming in yet. That’s because Prometheus doesn’t collect metrics on its own – it needs help.
That’s where exporters come in. Exporters act as translators between your system and Prometheus, exposing metrics in a format Prometheus can understand. In this chapter, we’ll dive into how exporters work, why they matter, and how to set up your first one.
🔌 What Are Exporters and Why Do They Matter?
Exporters are like the sensors of the Prometheus ecosystem. They gather metrics from your operating system, applications, databases, or services and expose them through a /metrics endpoint that Prometheus can scrape.
Think of Prometheus as a smart brain – but it needs eyes and ears to perceive your system. Exporters provide those senses.
📚 Table of Contents
🔍 What Are Exporters?
In the world of Prometheus, exporters are the bridge between your system and your metrics.
Prometheus itself doesn’t magically know what your CPU usage is or how much memory your database is using. Instead, it depends on exporters — small, purpose-built tools that collect data from a source (like your operating system, a database, or even a router) and expose that data in a format that Prometheus understands.
That format is a simple HTTP endpoint (usually /metrics) that Prometheus can “scrape” at regular intervals.
❓ Why Use Exporters in Prometheus?
Prometheus is designed to be simple, scalable, and modular — and one of the reasons it stays that way is because it doesn’t try to do everything itself.
Instead of directly collecting metrics from every application, operating system, or service, Prometheus delegates that job to exporters. This design brings several key advantages:
-
✅ Decouples Data Collection from Storage
Exporters do the heavy lifting of collecting system metrics. Prometheus focuses only on pulling and storing the data efficiently. This separation makes Prometheus faster and more reliable. -
✅ Keeps Prometheus Lightweight
By not embedding dozens of integrations, Prometheus stays clean and focused. Exporters can be deployed only where and when needed. -
✅ Promotes Reusability
Each exporter is usually tailored for a specific system (like MySQL, Nginx, or Node.js). That means you can reuse the same exporter across multiple hosts or projects without writing new code. -
✅ Works with Any System That Exposes
/metrics
As long as a service can expose data in the right format at an HTTP endpoint, Prometheus can scrape it. This makes it easy to monitor:- Physical servers
- Virtual machines
- Containers
- Even network switches via SNMP
🧰 Types of Exporters You Should Know
The Prometheus ecosystem includes hundreds of exporters, each built to extract metrics from a specific type of system, application, or device. Whether you’re monitoring your local Ubuntu server or a fleet of Kubernetes pods, there’s probably an exporter for it.
| Exporter | Purpose | Use Case | Default Port |
|---|---|---|---|
| Node Exporter | Exposes hardware and OS-level metrics | Monitor Linux servers (CPU, memory, disk, network) | 9100 |
| Blackbox Exporter | Tests endpoints using ICMP, HTTP, DNS, and TCP | Monitor uptime and availability of websites/APIs | 9115 |
| MySQLd Exporter | Collects metrics from MySQL/MariaDB | Track queries, table usage, DB connections | 9104 |
| cAdvisor | Gathers container-level metrics from Docker | Monitor container CPU/memory usage | 8080 |
| Windows Exporter (formerly wmi_exporter) |
Exposes system metrics for Windows OS | Monitor Windows servers and services | 9182 |
| SNMP Exporter | Scrapes metrics from network devices via SNMP | Monitor switches, routers, firewalls | 9116 |
🖥️ What is Node Exporter?
node_exporter is one of the most popular and essential exporters in the Prometheus ecosystem. It’s designed specifically to collect hardware and operating system-level metrics from Unix/Linux-based systems.
Once installed and running, Node Exporter exposes hundreds of metrics related to your system’s:
- ✅ CPU usage
- ✅ Memory and swap stats
- ✅ Disk I/O and free space
- ✅ Network traffic
- ✅ Filesystem stats
- ✅ System uptime
- ✅ Hardware information (e.g., thermal, power, entropy)
🛠️ Installing Node Exporter on Ubuntu
Let’s get Node Exporter up and running on your Ubuntu VM so Prometheus can start scraping real system metrics.
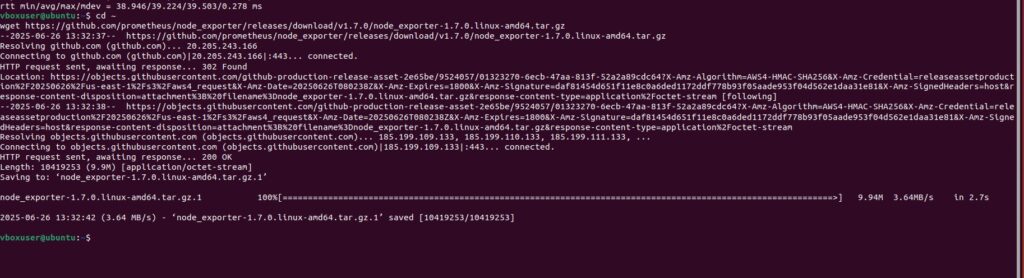
🔽 Step 1: Download Node Exporter
First, head over to the official Prometheus download page and grab the latest version of node_exporter for Linux.
Or simply run the following command on your Ubuntu VM (replace the version with the latest if needed):
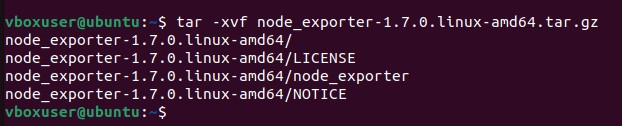
📦 Step 2: Extract the Archive
🚀 Step 3: Run Node Exporter

This starts a simple web server on port 9100, exposing all system metrics at:
http://localhost:9100
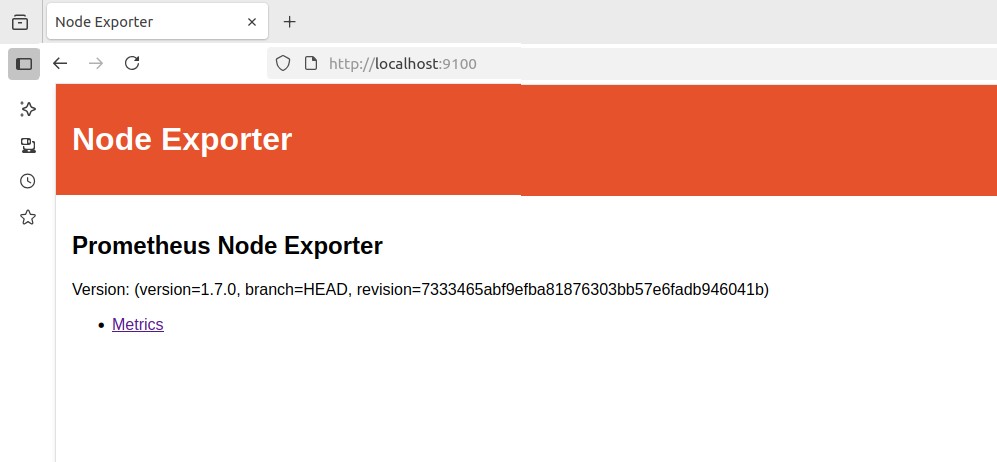
🌐 Step 4: View the Metrics in Browser
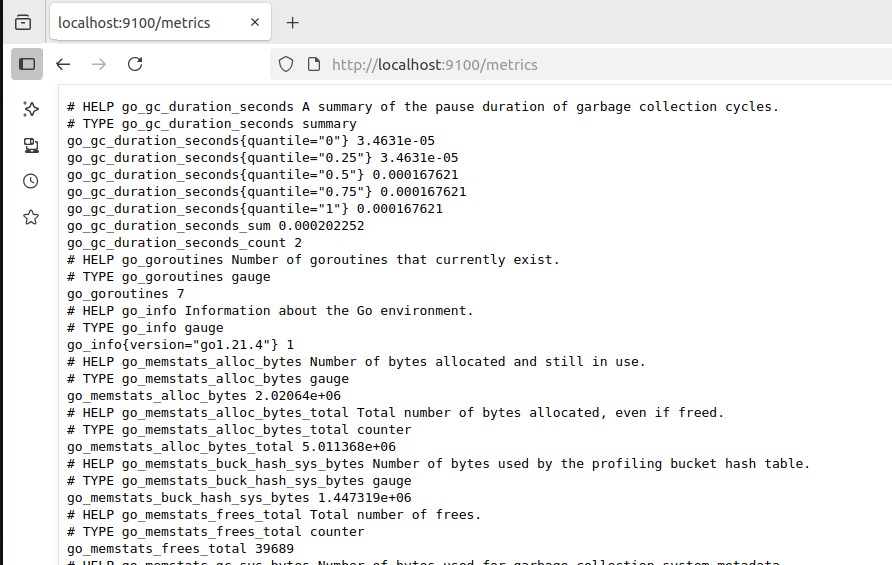
Once Node Exporter is running, you can view the raw system metrics it collects by opening the following URL in your web browser:
http://localhost:9100/metrics
This page displays hundreds of lines of plain-text metrics in the Prometheus exposition format — such as node_cpu_seconds_total, node_memory_MemAvailable_bytes, and more.
🧪 Step 5: Verify Node Exporter in Prometheus
Now let’s make sure Prometheus is scraping data from Node Exporter.
Open your Prometheus configuration file using your preferred text editor:
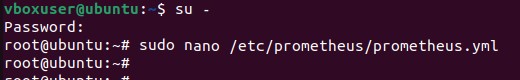
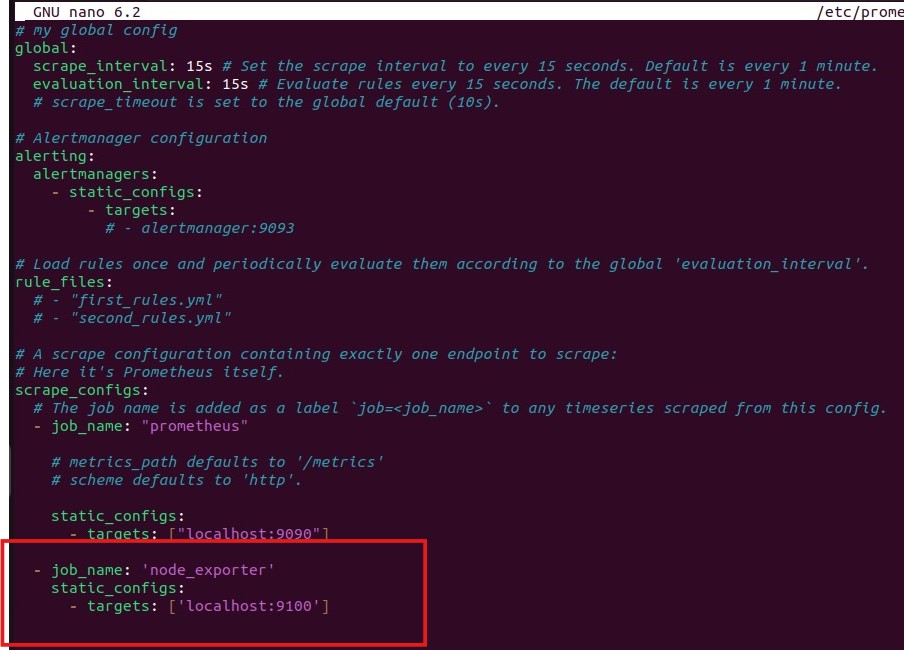
Add the following under scrape_configs:
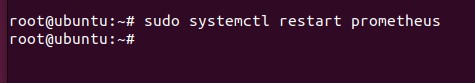
Save and restart Prometheus:
Visit Prometheus targets UI:
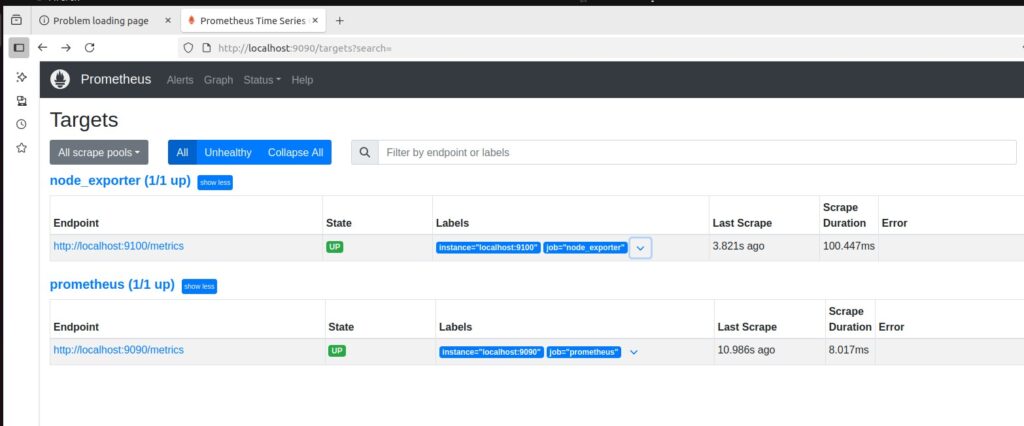
✅ Now you can see node_exporter listed with the status UP.
🤔 What’s Next?
Node Exporter is now live and feeding system metrics into Prometheus-great job!
But your dashboard still looks… raw. No charts, no alerts-just plain data.
So what’s next?
In Chapter 3, we’ll bring those metrics to life with powerful visualizations and smart alerts. Stay tuned 👀
Master Modern Monitoring & Logging 🚀
Learn Prometheus, one of the most popular monitoring tools, and get ready for the Prometheus Certified Associate exam.
Plus, explore Grafana Loki to gain hands-on skills in modern log aggregation and observability — a must-have for cloud-native engineers.
